Get our independent lab tests, expert reviews and honest advice.
Are your solar panels working?
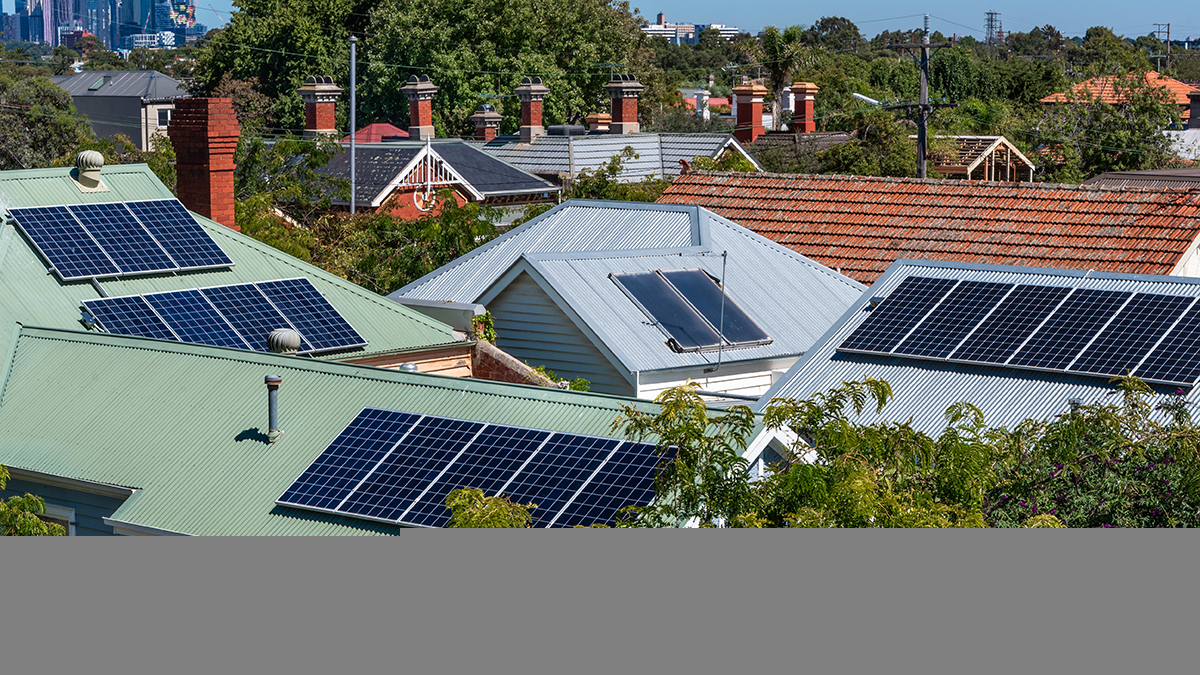
Many solar owners have little idea if the solar photovoltaic (PV) system on their roof is working properly.
On this page:
A 2018 CHOICE member survey found that about one in every three solar PV system owners had experienced problems with their system, with 11% reporting that their system was producing less energy than the installer told them it would, and 21% saying they had no idea if it was performing properly or not.
Solar PV systems can chug away quietly for years without an issue, but the figures above show it’s not unusual for an unknown problem to cost you money. If you’re not sure how well your solar panels are working, follow these six simple steps to do a quick health check of your system.
Step 1: Don’t rely on your electricity bill
Solar PV system owners often rely solely on their electricity bill to indicate any problems with their solar system, but we advise against this.
Here’s why:
- Your bill may come monthly, or quarterly; if your solar is underperforming, that’s a long time for you to be losing money.
- Your bill usually only shows how much power you exported to the grid, and how much you bought from the grid. It won’t show how much solar power was generated in total, or how much of it you used in your home.
- The amount of power generated by your solar panels changes from day to day and season to season, depending on factors like cloud cover and the number of hours of sunlight. And the amount of power you use at home can also vary a lot from day to day. That makes it hard to compare one bill with another in order to figure out how well your solar panels are performing.
Overall, while your electricity bill does provide a rough guide, it’s not the best way to check in on your solar PV system’s health.
Step 2: Look up – is there shading or dirt on the panels?
If you can, stand back and look at your solar panels. Are they clean and shiny, or dull and dirty?
Dirt and other soiling
Dirt isn’t usually a problem when there’s regular rainfall to wash the panels. However, any build-up of dust, tree sap, bird droppings or lichen will reduce the output of the panels and may even cause damage over a long period. Consider giving your panels a hosing from the ground if it hasn’t rained in a while. If the dirt won’t budge, hire a contractor with the right safety equipment to clean them for you.
Note: We don’t recommend using a ladder or going up on the roof to clean the panels yourself. Falls from a height are an extremely common cause of injury in Australia, with thousands admitted to hospital every year for this reason. You’re also dealing with high voltage equipment up there, and there may be a risk of damaging the panels.
Shade
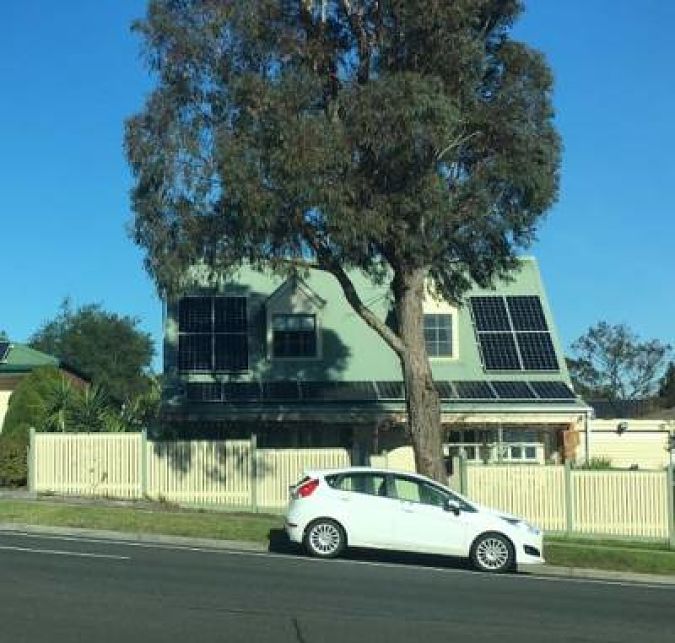
Shade is your solar system’s enemy. Is there more shade now than when your solar panels were installed? A nearby tree may have grown larger, a new roof structure like an antenna may have been installed, or a neighbour’s building extension may now be shading your solar panels for part of the day. This could mean your solar panels are no longer producing as much power as when they were first installed.
In most PV system installations, the panels are connected together in a ‘string’ to a wall-mounted inverter unit. In this design, shade on one panel can reduce the output of all the panels in that string, though this appears to be more likely with older panels. Recent tests indicate that modern panels handle shade better, so that while the shaded panel itself will drop its output, the rest of the string might be OK.
But if variable shading is common for your rooftop, you might consider instead going with micro-inverters. For this type of system, instead of one wall-mounted inverter unit, there is a micro-inverter on each panel (or alternatively, a power optimiser on each panel and a wall-mounted inverter). This helps maximise the output of each panel, so that the shading issue is confined to the affected panel only.
Deteriorating panels
Good-quality solar panels should be able to keep working for at least 25 years; however they don’t last forever, and they do lose some capacity steadily over time. Performance warranties usually guarantee that the panels will still be delivering at least 80% of their rated power after 25 years. Nevertheless, individual panels can fail faster than that. If you can do so safely, check the panels occasionally for any obvious signs of problems; for example, discoloured areas on the solar cells (usually a ‘hot spot’, where the panel overheated and was damaged).
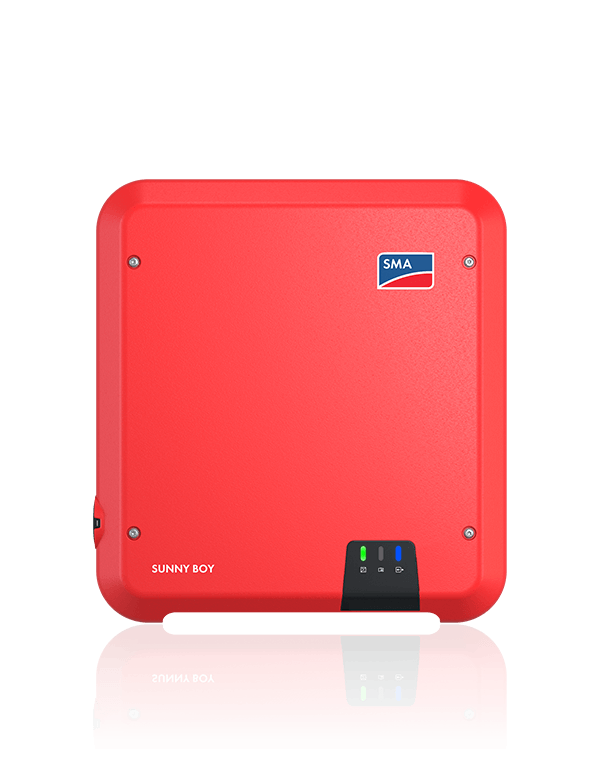
Step 3: Look at the inverter – is there a red or green light?
Many solar owners never pay attention to their inverter, but our survey found that 20% of surveyed solar owners had experienced problems with it. As the inverter is the most complex and hard-working component in your solar PV system, it shouldn’t come as a surprise that it’s often the first component to fail.
It is important to know what the indicators on your inverter actually mean. The installer should supply the instructions to you, but you can always look them up on the manufacturer’s website.
A simple way to check on the health of your system is to look at the colour of the lights shining on the box on a sunny day, when the system should be busily generating solar power.
A green light on your inverter means your system is functioning properly. A red or orange light during daylight hours usually means there’s a system event or fault.
A simple way to check on the health of your system is to look at the colour of the lights shining on the box on a sunny day
In the event of a red or orange light, or anything that looks different than usual, look for an error code on the inverter’s display. Alternatively, you may be able to go to the inverter’s user interface via a web portal for an indication of the cause.
Finn Peacock, founder of SolarQuotes (our partner for connecting you with solar installers in your area via the CHOICE Solar Estimator), agrees it’s important to regularly check in on your solar PV system’s performance.
“If there’s an error message on the inverter, call the installer,” he advises.
Inverters can shut down due to a grid fault where the voltage is too high or too low, or there may be a problem with the earthing of the system. Another reason might be that the circuit breaker for the inverter has tripped.
Step 4: View your system’s data
There are two ways to access the information about a modern solar PV system’s output from the inverter – on the digital screen (if it has one), and through an online account connected to your inverter.
The online data and graphs are more detailed and easier to understand and compare with your systems’ expected performance. They may give you monthly and annual output of the panels, in kWh.
What do those numbers on the inverter’s screen mean?
The data on the inverter’s screen isn’t as useful, but it should be able to give you three figures:
- The number of kilowatts of power being supplied to your house and/or the grid at that point in time (in kW).
- The number of kilowatt hours of energy it has produced so far that day (kWh). Check this after sundown for the day’s total.
- The number of kilowatt hours of energy it has produced in total since it was installed (kWh).
Power or energy?
When talking about electricity, power is the rate at which electricity is being delivered at any one moment, and is measured in watts (W) or kilowatts (kW). Energy is the amount of electricity that has been delivered or consumed over a period of time, and is measured in watt hours (Wh) or kilowatt hours (kWh). If your solar panels output 5kW of power, and do that for one hour, they will have produced 5kWh of energy.
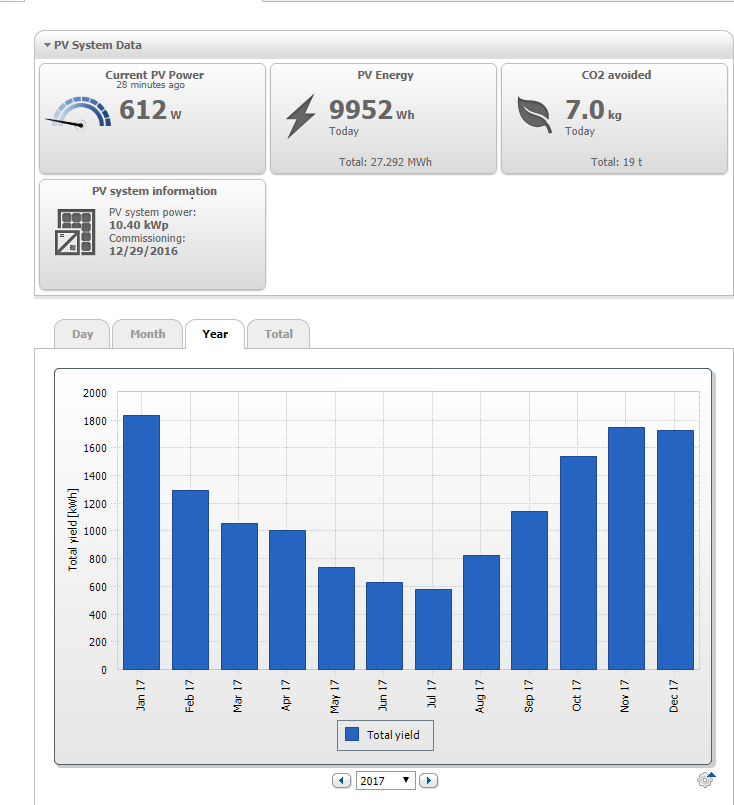
Accessing your solar output data online
Most good quality inverters offer easy-to-read graphs and data about your system’s daily, monthly and annual energy production by logging into an app or web portal. However, it probably won’t tell you about your energy consumption on site.
Our survey found that 32% of people track the performance of their system using the online interface for the inverter.
Your installer should be able to help you set up online access to your solar data, but if they didn’t, get onto the inverter manufacturer’s website and set up an account.
Pictured here is the output reading from a household system in Sydney, taken from SMA’s Sunny Portal site. (SMA lets you choose whether or not to make your data public.)
Step 5: How do you know if your solar is producing as much energy as it should?
When your system was installed, you should have been given an owner’s manual by the retailer or installer with an estimated prediction of your solar system’s production for each month of the year. It may be expressed as average daily kilowatt hours (kWh) per month, or the monthly yield.
Check the estimated amounts in the owner’s manual with the actual output revealed on your inverter’s account via the app or web interface (these figures aren’t usually available on the inverter’s screen). Or check it using a third-party monitoring system (see below).
Your system will never run at 100% efficiency
If you have 6kW of panels, then 6kW is the maximum output they can be expected to generate at any one moment under standard laboratory conditions. But in the real world they’ll almost never be 100% efficient.
Peacock says most solar systems in Australian conditions will peak at 80% of their specified maximum power – but that’s at midday in summer
Losses can occur with the inverter and the cabling, and the performance of the panels is affected by many factors including the ambient temperature, climate, and the angle and direction of sunlight falling on the panels. A well-designed and installed system minimises these losses and can deliver close to its rated amount of electricity under direct sunlight in the right conditions.
Peacock says most solar systems in Australian conditions will peak at 80% of their specified maximum power – but that’s at midday in summer.
For the energy nerds among us, you can get an estimate of your system’s expected output using this PV Watts calculator which uses BOM weather data.
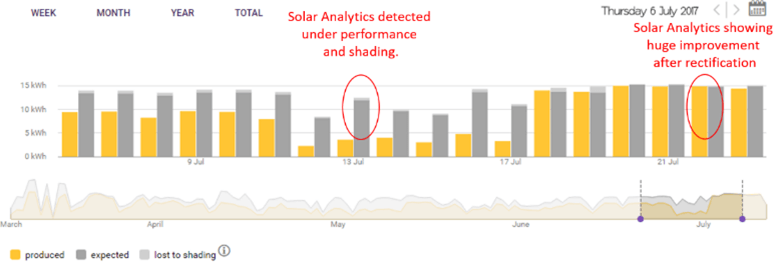
Step 6: Install a third-party solar monitor
To stay on top of your PV system’s health and make the best use of your solar power to save money, you could consider investing a few hundred dollars in a third-party solar monitoring system such as Solar Analytics.
These offer more sophisticated data and features than many inverter apps, such as detecting when the output is unexpectedly low and alerting you with an email or SMS.
A good-quality, third-party monitoring system will know the correct performance to expect from your panels and, using local weather data, will alert you if it drops below the minimum expected performance.
Not having monitoring on your solar PV system is like driving a car without a dashboard
Nigel Morris, Solar Analytics
And when you call the installer to fix the system, they’ll take your concerns more seriously if they know you’ve got a third-party monitoring system guiding you.
Nigel Morris from Solar Analytics says, “Not having monitoring on your solar PV system is like driving a car without a dashboard.”
“It simply gives you a 0-100% figure for your system health,” adds Peacock. “A friend started getting emails from their Solar Analytics system telling them to look at their system urgently.
“She got the installer round (he was happy to go around because he knew it was unlikely to be a false alarm thanks to the monitoring) and found a melted connector that could have been a fire risk!”
Monitoring also allows you to track your energy usage in the home and measure high-usage circuits and appliances to:
- reduce their use or upgrade them to more efficient models
- shift their use to daytime solar production periods.
Common factors that will reduce your solar power output
- High temperatures: A system can lose about 10% of rated power on a 25 degree day, and more if it’s hotter. A cooling breeze will improve the efficiency.
- Solar panel orientation and tilting: Panels facing due north will usually generate more energy (over the day) than those facing east or west, and they should be optimally tilted.
- System losses: Cabling loses about 2% of power while the inverter can lose 3-4% of power in the conversion from DC to AC power.
- Clouds and haze: Output drops with reduced solar radiation.
- Dirt and shading: Tree sap, bird droppings, shade, dust and grime can reduce output.
- Season: Naturally, there’ll be more production in summer, with more hours of sunshine per day, and less production in winter.
- Time of day: When you measure the solar power (kW output of your system) makes a difference. Midday is usually when it’s highest.

